Fibonacci Moving AverageFibonacci moving averages are a more reactive form of EMA utilizing the Fibonacci sequence (1 2 3 5 8 13 ... etc) to weight values.
This method gives several advantages of EMAs: they respond much sooner to price action while still weighting for past values and longer MAs (200 candle, 800 candle) etc moving averages can be calculated from candle 1 - handy for newly listed cryptocurrencies, equities, ETFs, etc.
The script allows for up to 5 moving averages. They can also be set as WMAs which weight older values more than recent to create slow/fast MAs.
They can be used the same way regular EMAs/WMAs are used: crossovers give trade entry/exit points, can indicate trend by alignment with other MAs and by their angle up/down, and - less useful for FMAs since no one else uses them - they can provide resistance.
Search in scripts for "Up down"
All TimeFrame OscillatorsI have always fighted to understand the market direction because it looks different on different timeframes.
I wanted an indicator where I can see all the different timeframes at once.
This indicator shows already existing oscillators but not only in the current chart's timeframe, but all the most important higer timeframes at once.
I have started with the stoch, then added as many oscillators as I could.
Experimenting with this I have saw that confluence of 4H 1D and 1W Stoch can be very interesting and can highlight higher timeframe take profit areas and sometimes major tops/bottoms.
Also bounces can be interesting when a lower timeframe stoch is bounced or rejected from a higher one.
Oscillators:
Stoch - Stochastic Oscillator
SMI - Stochastic Momentum Index
Rsi - Relative Strength Index
StochRsi - Stochastic RSI
WaveTrend - Vumanchu alias Market Cypher Wave Trend line
CCI - Commodity Channel Index
CCIStoch - Stochastic CCI
Williams Percent Range - Williams %R
Norm. MACD - Normalized Moving Average Convergence Divergence
Norm. MACD Hist - Normalized MACD Histogramm
PVT - Normalized Price Volume Trend
MFI - Money Flow Index
CMF - Chaikin Money Flow
Chande Momentum - Chande Momentum
Volume - Normalized Volume
CandleValue - Vumanchu alias Market Cypher MoneyFlow
BBWP - Bollinger Band Width Percentile
Line Type
Smooth: lines are smoothed, but the actualy not closed values are not shown
Step: Step lines, the actually open timeframes are calculated as they closed at the current values
Plot Oscillator or it's Slope:
its possible to not plot the oscillator but it's slope
Print dots when:
Cross Up/Down oversold/overbougt level - best for most oscillators. for example when Stoch crosses above 20 or below 80
Cross os/ob and the one higher TF is about to cross - when it's crosses beolw 80 and the higher timeframe oscillator is still above ans sloping down
Cross above/below middle line - for example on RSI being above or below 50 can be interesting
Print triangles when:
All Slope Match - all visible timeframe lines are pointing up or down at the same time
All above/belove middle line - all visible lines are above or belove the middle line
All above/belove middle line and slope match - like the previous one and the slope direction is the same
All above/below oversold/overbougt - all lines are above or below os/ ob. this is the default. it can be a very important confluence
Lower TF in order - 5, 15, 30, 60 minute timeframes are in order.
Higher TF in order - 4H 1D 1W in order (like 4H above 1D abd 1D above 1W). can be interesting at RSI
4H-1D in order - 4H 1D in order .
Print triangles
Print all triangles - print all triangles when the condition is met
Print only first triangles - only show when the condition starts to met
Print only last triangles - small triangles when the condition met first, large when last. tis is the default.
Timeframes to show:
You can turn on/off different timeframs to show or not from the list below:
1m 5m 15m 30m 1H 4H D 5D W M
This is for experimenting/ understanding the market direction on multiple timeframes at once.
Don't take it's signals (and any other indicator's) as exact trade signals. use it as confirmation instead.
Any comments, insights, ideas are welcome.

God Number Channel v2(GNC v2)GNC got a little update:
1) Logic changed a bit.
I tried to calculate MAs based on the power(high - low of previous bars).You can see it the M-variables, as new statements were added in calculation section of MAs. I don't really know if I did right, because I didn't go too much in Pine Script. I just wanted to make a Bollinger-bands-like bands, which could predict the levels at which might reverse, using legendary fibonacci and Tesla's harmonic number 432. It's might sound as a joke, but as you can see, it works pretty good.
2) Customization :
No need to change Fibonacci ratios in code. Now you can do it in the GNC settings. Also MAs' names were made obvious, just check it out. Time of million similar "MA n1" has passed :)
3) Trade-entry advices :
I didn't tell you exactly the trade-entry advices, as I haven't explored this script fully yet :) But you probably understood something intuitively, when added GNC on the chart. Now I made things way more obvious:
1. Zones between Fib ratios show you how aware you should be of price movements. Basically, here are the rules, but you probably understand them already:
1.1 Red zone(RZ) : high awareness, very likly for price to be reversed, but if there is a clear trend and you know, than it might be a time for price to shoot up/down.
1.2 Orange zone(OZ) : medium awareness, not so obvious, as price might go between boundaries of OZ and continue the trend movement if such followed before entering the OZ. If price go below lower boundary of OZ and the next bar opens below this boundary, it might be a signal for SHORY, BUT(!) please consider confirmation of any sort to be more sure. Think of going beyond the upper boundary by analogy.
1.3 Green Zone(GZ) : if the price hits any boundary of green zone, it is usually a good oppurtunity to open a position against the movement(hit lower boundary -> open LONG, hit upper boundary -> open SHORT).
1.4 Middle Zone(Harmonic Zone)(MZ) : same rules from Green Zone.
IMPORTANT RECCOMENDATION : Use trend indicator to trend all signals from zones to follow the trend, 'cause counter-trending with this thing without stop loss might very quickly wipe you out , might if you will counter-trend strategy with GNC, I will be glad if you share it with the community :)
Reccomendation for better entries :
1) if the price hits the lower(or high) boundaries(LB or HB) zone after zone(hit LB or HB of RZ, then of OZ, then of GZ), it is a very good signal to either LONG, if price was hitting LBs , or SHORT, if hitting HBs .
2) Consider NOT to place trades when in MZ, as price in this zone gets tricky often enough. By the way, if you dont the see the harmonic MAs(which go with plot(ma1+(0.432*avg1)) ), then set the transparency of zone to 20% or a bit more and then it will be ok.
I will continue to develop the GNC and any help or feedback from you, guys, will be very helpful for me, so you welcome for any of those, but please be precise in your critics.
Thank you for using my stuff, hope you found it usefull. Good luck :)

No Supply/Demand barsThe VSA (Volume Spread Analysis) definition for No Demand and No supply is as follows:
No Demand (no buyers-potential short position):
The Volume within the candle formation again has to be lower than the volume of the previous 2 candles.
The candle has to close bullish (green body) and the next candle has to close bearish.
There has to be some sort of rejection (pin or wick) at the high of the candle.
If the candle closed at the top it would not be a no demand candle.
No Supply (no sellers-potential long position):
The Volume within the candle formation has to be lower than the volume of the previous 2 candles.
The candle has to close bearish (red body) and the next candle has to close bullish.
There has to be some sort of rejection (pin or wick) at the low of the candle.
If the candle closed at the bottom it would not be a no supply candle.
Simple indicator, to show No Supply bars and No Demand bars:
No Supply bars = No S in green color
Do Demand bars = No D in red color
If No Supply/Demand bars is Outside bars, it will shown as No S/D Outside with the same color. In special case, if it's a Engufling pairs, it's will shown as Engul Up/Down with the same color.
You can chose option Filter volumes to confirm the second bar's volume higher prev bar's volume

[FR]Custom Candles/FVG/nSideBarCustom Candles /FVG/ nSideBar
- I used this as a learning project for understanding plot()'s Better
- My goal was to see if I could use normal plots to cleanly plot FVGs on the chart using only plots with out and boxes/lines
The problem was if multiple FVGs were on back to back bars the plot fill would fill the line to the next FVG/Bar
I solved this by using 4 plots and alternating them if consecutive FVGs form
- 2 MODES
- Slim
- Normal
//////////////////////////////////////////////////////////////////////////////////////////////////////////////////////////////////////////////////////////////////////////////
-Slim
Uses 3 plotcandle() parts and divides the candle between body/wicks/open and close
by manipulating the ohlc inputs and the colors I was able to pretty make them full customizable
all components are customizable with up/down colors
-Normal
These are your normal candles but they are full customize able from components to individual up/down colors
--------------------------------------------------------------------------------------------------------------------------------------------------------------------------------------------------------------------------------------------------------
- FVGs
There are 2 FVG settings can be used with both MODES
- Big
These are the FVGs that use plots and since there isn't a 500 object limit on plots you don't need to manage them in the code and they are there how ever far you need to look back
- Slim
These use a Line and the width of the line can be adjusted for user preferences
--------------------------------------------------------------------------------------------------------------------------------------------------------------------------------------------------------------------------------------------------------
- INSIDE-BARS
These will change the color of the body of either SLIM or NORMAL Candles
--------------------------------------------------------------------------------------------------------------------------------------------------------------------------------------------------------------------------------------------------------
Drawing Snap Features Work Just Fine!
I suggest hiding your chart candles with the eye in the top left of the screen and moving the indicator to the top of your object tree
I understand that the candles in the chart pictures are impractical I was just demonstrating the functionality of the tool
Hope You Enjoy!!
FFriZz

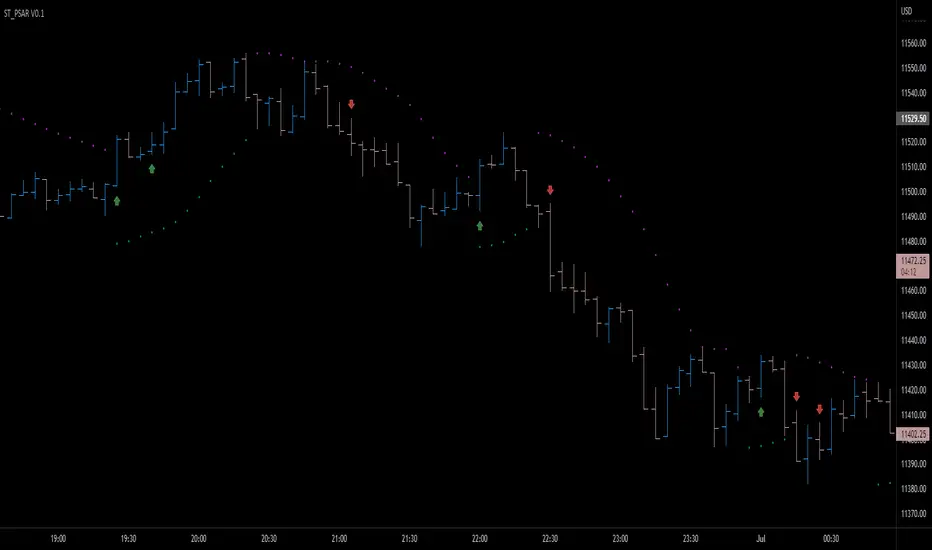
Parabolic SAR breakout [SugarTrader77]Parabolic SAR with:
- On chart visuals
- Alarms
to notify when price breaks up/down the SAR flipping point level
Created only for community testing only. Trade at your own risk.
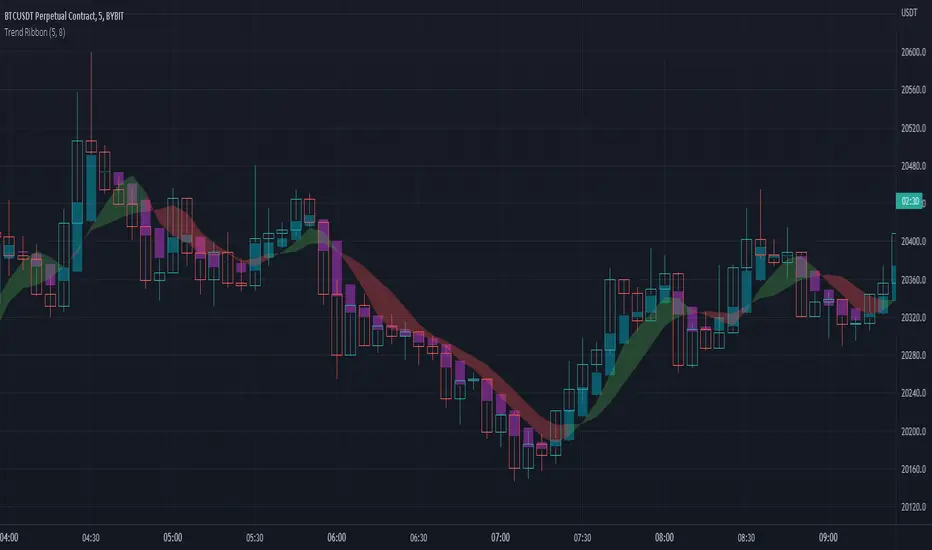
Trend Ribbon on Heiken AshiThis indicator shows mini trends using 2 Simple Moving Averages based on Heiken Ashi candles.
This indicator also shows overlay of Heiken Ashi candles, so you can stay on standard candles and see actual price.
This indicator helps finding entries on Heiken Ashi breaking up/down at M1-M5 timeframe.
No-lose trading targets (Based on MFI) By Mustafa ÖZVERThis code shows expected reaction target prices after sudden moving based on MFI . Red area means the price is on overbought area, green area means the price is on oversold area. If you see red area under price, you can make short option to next to the horizontal beginning price of red area. If you see green area over price, you can make long option to next to the horizontal beginning price of green area.
When this code works
- The green area starts where mfi value is on oversold
- The red area starts where mfi value is on overbought
Of course, this code may be failed, do not forget the target may never come. But hopefully price will cross over the target.
And you (as developers) can develop this code by using anything instead of mfi to get up-down target prices.
But only this values can not guarantee good results for trading. BE CAREFUL

Multi-timeframe Moving Average with Summary TableThis script aims to keep you orientated with regard to moving averages on higher time frames when working in the lower timeframe. It will show the given MA specification from you current timeframe and the timeframes above. In addition, it also shows a summary table of what the MAs on the other timeframes are doing (trending up/down, flat).
So if you are on the 15 minute timeframe looking at the 20SMA you will know where the 20SMA is on the 1hour, 4hour, 1D, 1W, 1M. You also know the direction of the upper timeframe mas (the 1 hour is trending up but the 4hour is flat etc).
Defining whether an MA is trending is a little subjective but the script making a reasonable job of it - it compares the current MA level to the MA level the defined bars back and compares that to the average true range. (That way it works the same across all currencies regardless of their natural volatility. There is a check feature so you can understand the results your settings are creating.
summary table
show mas
check feature

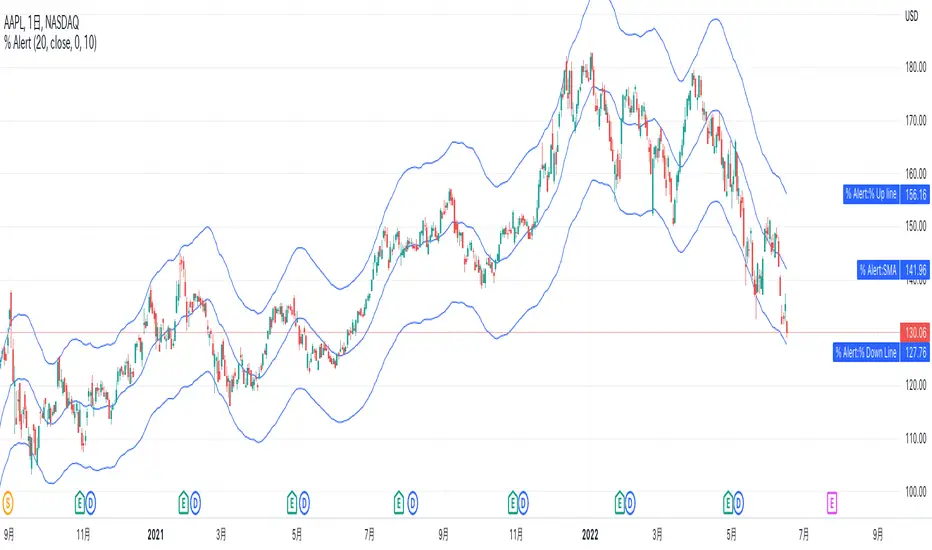
% up/down from SMA AlertsHi all! This script allows an alert option for conditions when the price increase 10% from the SMA and when price decrease 10% from the SMA.
The SMA length defaults to 20, but can be set to any length of your preference at “length” in the inputs tab of the script settings.
Value that increase and decrease 10% from SMA is able to visualize with a line but it can also be hidden in the Style tab.
Also, the default is 10%, but you can set % value of your preference such as 2%, 5%, at "% value" in the inputs tab.
For example with the default settings, if you set the alert condition "% up SMA" in the Alert settings dialog, this alert will be triggered when the price increase 10% from SMA. "% down SMA" will be triggered when the price decrease 10% from SMA.
-----------
このスクリプトは、価格がSMAから10%上昇した時と、10%下降した時の条件のアラートオプションを可能にします。
SMAの期間はデフォルトで20ですが、スクリプト設定のパラメータータブにある「期間」でお好みの期間に設定できます。
そしてこのSMAから10%上昇した値と下降した値は、ラインで視覚的に表示されますが、タイルタブで非表示に指定することも可能です。
また、デフォルトは10%ですが、2%や5%などと、パラメータータブにある「% value」でお好みの%値を設定する事ができます。
例えばデフォルト設定の場合、アラート設定ダイアログで条件を「% up SMA」で設定した場合は、もし価格がSMAから10%上昇したらアラートがトリガーされます。
「% down SMA」を指定した場合は、もし価格がSMAから10%下降したらアラートがトリガーされます。
Super Sniper - Screener - MTF- Multi Asset -Multi IndicatorSuper Sniper Screener with Multi Indicator EMA Crossover, Trend, ADX, MACD, SSL, CCI, STOCHASTIC, RSI, HMA, QQE, WAE. Trade Entry/Exit with multiple Indicator for Multiple Assets and Multiple Timeframe. if you are on a Higher / Lower Time frame and are looking for Entry/Exit based on a lower timeframe then this indicator is the best. The all in one screener for EMA Crossover, Trend, ADX, MACD, SSL, CCI, STOCHASTIC, RSI, HMA, QQE, WAE
What is Sniper Entry?
if you are on a Higher / Lower Time frame and are looking for Entry/Exit based on a lower timeframe then this indicator is the best.
About this indicator.
horizontal Lines are in pink (down) and blue(up) color grey (neutral)
10 horizontal lines are plotted each for a timeframe + Asset / Currency / Stock
Back ground represents UP/DOWN Trend based on EMA 200 with the current time frame.
RED-Dot and GREEN-Dot are buy sell signals of SSL Channel for current Time Frame.
You can choose only one type of indicator (EMA Crossover, Trend, ADX, MACD, SSL, CCI, STOCHASTIC, RSI, HMA, QQE, WAE) for all the 10-lines
Select Asset and Timeframe for Each Line on the Graph.
Based on the color of the line and changes on Multi Timeframe you can ENTER/EXIT a Trade on current Timeframe.
Hence a Sniper Entry with multiple Indicator Screener

LTF -> HTF volume delta Up/DownThis script derives from my previous Educational LTF -> HTF volume delta script.
Total volume is displayed as columns in the background.
With request.security_lower_tf() we get data from a lower timeframe.
In this case, volume, which is placed in an 'up-array' when the 'lower timeframe close' > 'lower timeframe open',
or in an 'down-array' when the 'lower timeframe close' < 'lower timeframe open'.
This is displayed here as 2 (red/green) lines
When you're at a chart timeframe (Higher timeframe), lower than Daily, the lower timeframe is automatically 50x smaller than the higher timeframe.
Example D = 1440 minutes -> divided by 50 = 28.8 or rounded a lower timeframe of 29 minutes
When this number is below 1, it will take the '1 minute timeframe' as lower timeframe
If the higher timeframe chart is Daily or higher, a 'x minute-lower timeframe' chart is calculated from the timeframe.multiplier multiplied by 25,
for example a 2D higher timeframe will do the 'lower timeframe calculations' with a 50 minute TF (25 * 2 'D')
Looking at for example BTC on the Daily higher timeframe, some interesting observations can be done when looking at the 'spikes'
This script doesn't have build in arrows, it is merely made to give some stimulation,
and hopefully some of you can work further on this technique, because I think it is very promising!
I want to thank Tradingview very deeply, why?
Just so many reasons, development, moderation, organisation, helpdesk, ...
The amount of work they are doing is incredible!

Treat Sideways👉 What is this indicator ?
Understanding the Sideways Trend is the best trading method, and we have written this script intending to make you a better sideways filter indicator. Treat Sideways helps you understand the sideways trend and trade in a risk free manner.
👉 On which coins can this indicator be used ?
This indicator is best used on all cryptocurrencies, stocks , forex markets
👉 How work this indicator ?
We understand the trend using our secret logic and price action, and After that, we mark the sideways movement in a box. The moving average line helps us to construct this indicator.
👉 Default Coin and Time Frame ?
XRPUSDT
Time Frame : 1 min
MA Line Color Details 👇
The Blue color of the MA line indicates the Sideways Trend
The Red color of the MA line indicates the Down Trend
The Green color of the MA line indicates the Up Trend
Indicator Settings 👇
Box Height : This setting can be used to set the size of the Sideways trend
Time Gap : This option is used to control unexpected down trend and up trend
Up Down Threshold : This option should be adjusted according to the time frame and voltality
Color :
Option to change the color of the box that appears in the sideways trend
Border Color : Option to change the color of the box border that appears in the sideways trend
Opacity : Option to change the opacity of the box border that appears in the sideways trend
Line Width : You can adjust the width of the MA line with this option

Ultimate Custom ScreenerThis indicator will allow you to make your custom TradingView screener without coding. Add it to the chart, select up to 40 symbols and five indicators, and the screener will do the rest for you. The indicator will form a lovely table with all values and highlighted signals.
The screener is highly customizable, and you can choose its position on the chart, sorting, order of the columns, colors for the tables, and all signals separately. You can easily change parameters for all supported indicators and their signals.
Currently, there are 19 different custom indicators available. Current list of indicators:
Average Directional Index (ADX) - displaying the value of ADX and checking if it's higher than the threshold
Average True Range (ATR) - showing the value of ATR
Awesome Oscillator (AO) - displaying the value of AO and highlighting positive/negative values.
Bollinger Bands (BB) - showing if the price is above/below/in the channel.
Breakout Pivots - Displaying when the price is below/above the most recent pivot low/high.
Commodity Channel Index (CCI) - shows the last CCI value and highlights overbought/oversold values.
Directional Movement Index (DMI) - Up/Down signal (+DI above or below -DI)
Donchian Channel (DC) - showing if the price is above/below/in the channel.
Historical Volatility (HV) - Current value of Historical Volatility
Keltner Channel (KC) - showing if the price is above/below/in the channel.
Moving Average Convergence Divergence (MACD) - Up/Down signal (MACD above / below signal)
Moving Average Crossover (MA Cross) - Displaying MA crosses signals (SMA, EMA, WMA, HMA, VWMA, SMMA, DEMA, VWAP supported)
Moving Average Distance (MA DIST) - Displaying distance to the MA (SMA, EMA, WMA, HMA, VWMA, SMMA, DEMA, VWAP supported)
Price - Displaying the last price for the instrument
Relative Strength Index (RSI) - Displaying the last RSI value and highlighting overbought/oversold values.
Stochastic (STOCH) - Displaying the last Stochastic value and highlighting overbought/oversold values.
Stochastic RSI (STOCH RSI) - Displaying the last Stochastic RSI value and highlighting overbought/oversold values.
SuperTrend - Current state of the SuperTrend.
True Strength Index (TSI) - Displaying the last TSI value and highlighting overbought/oversold values.
We're already working on adding a few more supported indicators. If you have any ideas about the indicators you want to see in our screener, contact us, and we'll consider them.
Disclaimer
Please remember that past performance may not be indicative of future results.
Due to various factors, including changing market conditions, the strategy may no longer perform as well as in historical backtesting.
This post and the script don’t provide any financial advice.
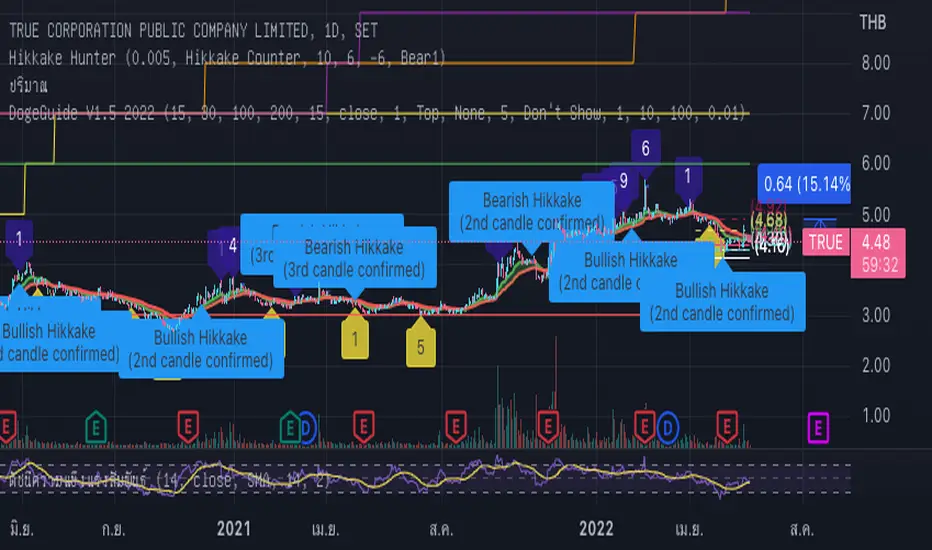
DogeGuide V1.5 2022## DogeGuide V1.5 ## Pine Script V5
This is a very simple indicator that will provide users with a way to see EMAs
(exponential movingaverages), Includind the highlight between two EMA lines,
which are 15 and 30 lines.
EMAs are very strong support and resistance indicator to guide user though these tool by
fixed and default settings. And, easy to customize later are the main goal of this indicator.
## Easy to use for beginer ##
The EMA lines are given as common numbers, 15, 30, 100 and 200.
also user are allow to turn on one additonal line themselves.
the ribbon will show up/down trend based on EMA highlighten background for easy understanding.
In addition , Support and Resistance dot are added to help user to get the idea of where they are now.
whether to exist or not (just a tool to help you make decision).
There is a Buy/Sell label based on technique above, MACD and SET:SET Divergence signal.
Also, there is a small circle label to help with reading the buy and sell signal.
## Note ##
The indicator is set to work best with 1 day time frame.
RSI and Volume will help a lot to make a decision.
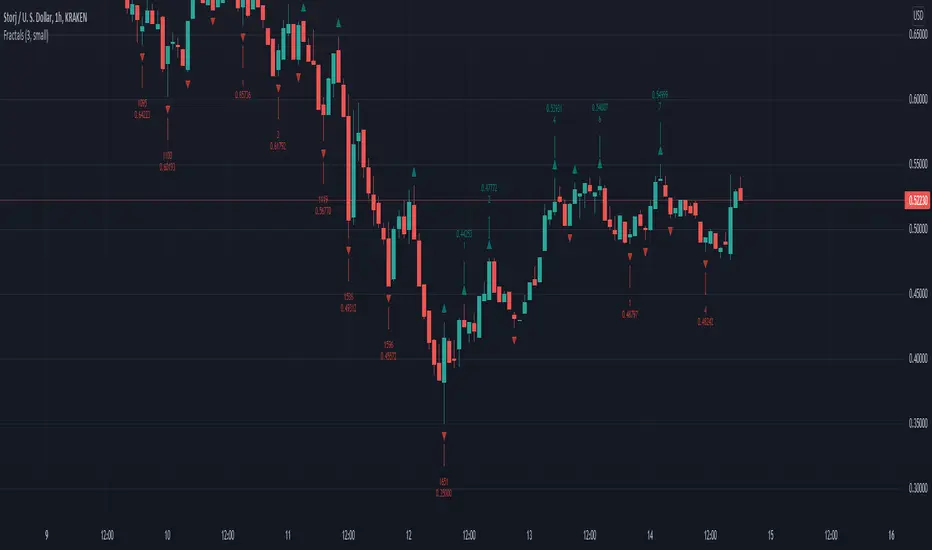
Williams Fractals with BreaksThis is a Bill Williams fractal indicator with breaks.
I was turned onto fractals and the importance of their breaks by ChaosTrader63.
I know several version of this indicator have been done.
I chose this as a first project because of it's simplicity , but also because of the poor code quality of some other versions I looked at.
This is the first draft that successfully met my three criteria:
* Must identify all fractals, including simultaneous up/down fractals.
* Must identify fractal breaks with a clear indicator.
* Must provide information on how many fractals
For the first bullet, I wanted to provide a more concise modern version than the boolean logic composition I was seeing in other examples.
The later two required tracking the past which was not present in the other versions I looked at.
Code here can be improved for more uses and better integration, but it is functional and elegant enough to use.
Thanks for checking it out.
Jolly Wizard
UVOL_DVOLNYSE UP/Down Volume Ratio.
Use 4 Hours data.
The upper bands are the stander deviations of the ratio.

Tick travel ⍗This script is a further exploration of 'ticks' (only on realtime - live bars), based on my previous script:
- www.tradingview.com -
What are 'ticks'?
... Once the script’s execution reaches the rightmost bar in the dataset, if trading is currently active on the chart’s symbol,
then Pine indicators will execute once every time an update occurs, i.e., price or volume changes ...
(www.tradingview.com)
This script has 2 parts:
1) Option: ' Tick up/down'
This is a further progression of previous work.
During bar development, every time there is an update (tick), a dot is placed.
If for example there is 1 tick (first of new bar), a dot will be placed on 1,
if it is the 8th tick off that bar, there will be a dot placed on 8.
While my previous script had the issue that there was an upper limit per bar (max 32),
this script (because it is working with labels) can place max 500 dots.
For each bar this is better, it has to be mentioned though that looking in history, once the limit of 500 has been reached,
you'll notice the last ones are being deleted. This is one of the reasons the script is not suitable for higher timeframes
(1h and higher, even higher than 5 minutes can give some issues if it is a highly traded ticker), if a bar would have more
than 500 ticks, they won't be drawn anymore (which is not desirable of course)
2) Option: ' Tick progression'
These are the same ticks, but placed on the candle itself, or you can show the candle:
Or 'without' candle (or 'black' colour):
When 'No candles' are enabled, the 'candles' get the colour at the right.
At the moment it is not possible to drawn between 2 candles, this technique uses labels with 'text',
each tick on a candle will have a 'space' added, so you can see a progression to the right.
Colours
- if price is higher than previous tick price -> green
- if price is lower than previous tick price -> red
- otherwise -> blue (dimmed)
There are options to choose the 'dot', when choosing 'custom',
just enter (copy/paste) your symbol of your choice in the 'custom' field:
Caveats:
- Labels and text will not always be exactly on the price itself
- The scripts needs more testings, possibly some ticks don't always get drawn as they should.
The lower the timeframe, the more possible issues can occur
- Since (candle option) the dots move to the right, the higher the timeframe and/or the more ticks,
the sooner ticks will go in the area of next candle.
That's why I made a separate 'start symbol'
-> This is the very first tick on each candle, then you can zoom in/out more easily until the dots don't merge into each other candle area:
A timeframe higher than 5 minutes mostly won't be feasible I believe
This script wouldn't be possible without the help of @LucF, also because of his script
With very much respect I am hugely inspired by him! Many Thanks to him, Tradingview, and everything associated with them!
Cheers!

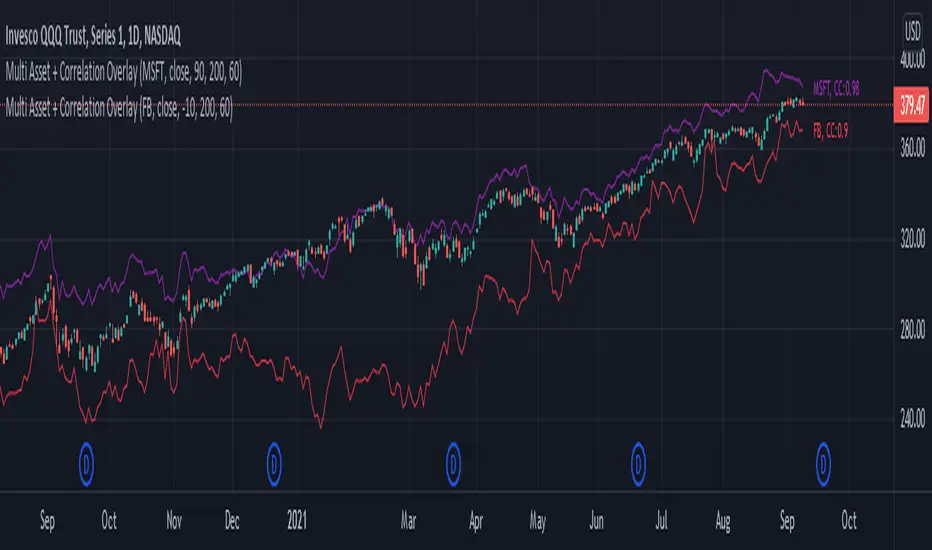
Multi Asset + Correlation OverlayFrom time to time, you may want to overlay multiple assets on the same chart instead of using multi-chart views. This can be a much cleaner way of viewing and comparing multiple assets. There is some functionality built into TradingView that lets you do this to a certain extent, but I wanted additional options, correlation labeling and ways to adjust the overlay location. So, today I am releasing to the community my Multi-Asset + Correlation Overlay script / indicator.
What is does: This script allows you to overlay the price of any ticker onto your chart. It also labels the line with the ticker name, and calculates / labels the correlation coefficient of your newly overlayed asset.
How to use it: Add the indicator to your chart. Then, go into the indicator settings to set the ticker of the asset you want to pull in along with how you want to "offset" it. Your 2 tickers may not be priced near each-other, so the offset setting allows you to pull the ticker you added up/down to better visually align with your chart's price range/layout. For instance, if the asset you added is priced $400 higher than the underlying chart price, you may want to set the offset to -400.
If you would like to add multiple tickers and multiple overlays, you can do that by just adding the indicator to your chart more than once. The color is adjustable, and the ticker of the asset will print to the right of the line representing the asset price. The script also calculates the correlation coefficient between the ticker overlay and the underlying chart asset. The correlation coefficient prints to the right of the ticker.
Tick up/downWith this script I aim to explore 'ticks' a bit more (only on realtime - live bars).
... if trading is currently active on the chart’s symbol, then Pine indicators will execute once every time an update occurs, i.e., price or volume changes ...
( www.tradingview.com )
On every bar, everything gets reset.
During bar development, every time there is an update (tick), a dot is placed.
If for example there is 1 tick (first of new bar), a dot will be placed on 1,
if it is the 8th tick off that bar, there will be a dot placed on 8.
Colours:
- if price is higher than previous tick price -> green
- if price is lower than previous tick price -> red
- otherwise -> blue (dimmed)
Because of the maximum allowed amount of plot's, I only can plot max. 32 dots, so max. 32 ticks.
Therefore this script is only useful on a 1 sec or 5 sec chart.
Otherwise, all ticks - updates more than 32/bar won't be displayed.
Frankly, I'm not sure about the benefit for trading, this script can be seen more as exploring what is out there.
Cheers!

ATR Report & Tool█ OVERVIEW
This indicator reports the historical probabilities of the price trading past its Average True Range (ATR).
█ CONCEPTS
It is common knowledge that the market is not likely to trade past 1x ATR. Is this true? How much unlikely exactly? The indicator reports the data in a table and tells you precisely how often the price made it past x times ATR.
You have identified two plausible entries at different price structures or two targets at significant projections; which one should you choose? While is it possible to reach them, is this indeed probable? The indicator complements your analysis for making sounds trading decisions.
█ FEATURES
Price Selection Tool
The indicator has a price selection tool embedded. You can select a price on the chart and it will show the distance relative to the ATR so you can easily refer to the historical probability table.
Multi-Timeframe
By default, the indicator uses the daily timeframe for analyzing how much price moves compared to its average volatility during a day. To the same extent, you can set it to any other timeframe.
Configurable ATR
• Pick your preferred smoothing between the Simple Moving Average (SMA) or the Relative Moving Average (RMA).
• Set the length for getting the average price movement. For example, you can set it to 20 for the daily ATR (20 trading days in a month), 12 for the weekly ATR (3 months), or 6 for the monthly ATR.
• Select the reference between “previous” or “current” ATR value (default set on previous).
Data Window
The indicator provides additional volatility-related values and reporting data.
Others
Automatically hides the indicator when the chart’s timeframe is higher than the indicator’s one.
█ NOTES
Calculation
The volatility is calculated from the selected period's low to high. It may use the previous close when the market gaps up/down.

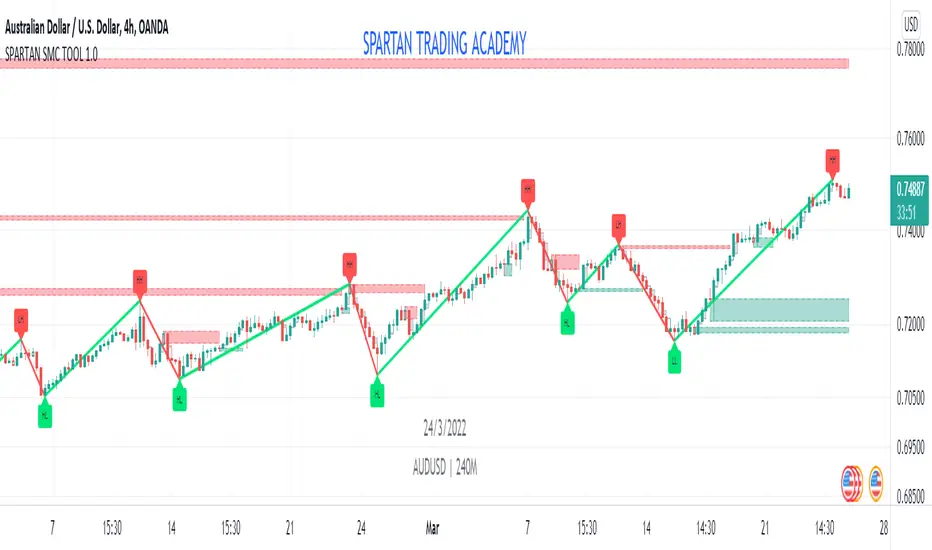
SPARTAN SMC TOOL 1.0SPARTAN SMC TOOL 1.0
1. Order Block
2.Double Zig Zag
3. Imbalance
//--------------------- details about smc tool -----------------------//
Order Block:
I) The Order Blocks are NOT DETECTED in REAL TIME!
- A Bullish Order Block is the last red candle BEFORE a subsequent series of green candle
- A Bearish Order Block is the last green candle BEFORE a subsequent series of red candles
The required length of the series is defined by the parameter "Relevant Periods to identify OB" (by default it is set to 5).
This means that the earliest an Order Block can be identified with these settings is 5 candles AFTER it has occurred!
As a result of this....
II) The identified Order Blocks (and therefore also the Alerts) are not BUY or SELL signals!
As I have mentioned in the description before, these identified Order Blocks rather show "Areas of Interest" on the chart where there is an increased probability that the price will revisit these levels at one point in the future (but no guarantee of course!).
III) ....and YES, it REPAINTS....by definition!
A "repainting" indicator is changing signals in the past. As according to the defined logic an Order Block can only be identified AFTER future conditions are met, it will of course "repaint" the signal into the chart only after at least the relevant period has elapsed - the same applies to the Alerts. If you intend to complain about this "repainting", then I am sorry to say that you did not understand what this is used for and I advise you not to use this indicator. I would then advise you to first read a bit about Institutional Order Flow.
IV) This is not the "Perfect Indicator".....
When you look at the historical performance on the chart, it looks like that the Indicator ALWAYS called a perfect entry! But due to the definition of the logic and due to the delay/repainting, this is misleading if you do not understand how it is supposed to work. So please make sure that you REALLY understand it before you use it - I tried to be very clear in my explanations.
Double Zig Zag:
Here Double Zig Zag with HHLL script is with you. it calculates 2 Zig Zag simultaneously and draws them, and also it calculates and puts Higher High, Lower Low, Higher Low, Lower High labels. All these are done dynamically, it means last HH/HL/LL/LH can change. if price continues to go up then HL can turn to LL or if price continues to go down then LH can turn to HH. This script can be used for different purposes such trend analysis, support/resistance levels, breakouts etc.
I tried to make many things optional:
You can set Periods for Zig Zags as you wish
You can set different colors for both Zig Zag Up/Down lines
You have option to show both Zig Zag , one of them or none them
You have option to show both HHLL, one of them or none them
You can set Zig Zag 1 line style as Dashed or Dotted
You can set Line Widths for Zig Zags
Imbalance and Fair Value Gaps
Imbalance and Fair Value Gaps are created when Price moves away in one direction at speed / impulsively.
A gap is created between the first and third candle wick which creates the Imbalance / Fair Value Gap and is sometimes a potential area of where the market could return
making the area a good place to look to trade from or to aim for.
This Imbalance / Fair Value Gap indicator will change the color of the candles where these gaps have been created and also created a Line at the start of the Gap.
Although the candle color will not change, the lines however will be removed when price has closed the Gap making it easier to look for the untouched Imbalance / Fair Value Gaps when opening the charts or changing between timeframes and allowing you to create your potential areas to trade from or areas to target.
You are also able to add a shape on the gaps and change style of lines created along with the width and length.
From the testing I have carried out whilst trading, using more than a 500 bar look back seems to cause issue so this is the max you can set the candle look back.
There are other Imbalance / Fair Value Gap indicators but I just wanted to create one with a few additional options which suited my trading style.
Hope you find it useful and happy safe trading...
Seth_Signal
This script designed to identify up, down, and sideways trends. 200 HMA , 9 EMA , PSAR, and ATR are used to identify the strength of any instrument.
Candle Colors - Simpler approach to follow:
Green color indicates for up side trade signals
Red color indicates for down side trade signals
Yellow color can be interpreted for stop, sideways, and counter trade trade signals
Multiple Trade Setups:
Green Zone - Trading green candles within green zone has better odds of long trades
Red Zone - Trading red candles within red zone has better odds of short trades
200 HMA - Candles above 200 HMA mostly for long trades. Candles below 200 HMA usually for short trades. But the zone also very important to consider
9 EMA - Cross over above 200 HMA in Green zone, look for long trades. Cross over below 200 HMA in red zone, look for short trades
PSAR - This can be used as potential initial warning sign. Also can be used to exit partial or wait for it goes to opposite side for taking trade decisions
Candle Above all - If Green candle and above all the indicators, then very good sign of long side. If red candle and below all indicators, then very good sign of short side.
Multiple Time Frame:
This works very well with any instrument and on any time frame. Always its better to do analysis on multi time frame before entry, exit, and trade execution. Back test it with this setup and also observe it on live market. That will give edge in taking trade decisions. All the best and happy trading.